Protein Estimation Assays
Before beginning a Western blot experiment, one of the first things you will need to know is how much sample to load in each lane. The only way you can be sure that you are loading a consistent amount of protein is to perform a protein estimation assay first. Not only is consistent loading critical for meaningful normalization, but inconsistent loading can lead to inconsistent results and inaccurate conclusions.
Why Protein Estimation Assays Matter
Knowing how much protein you are loading can help ensure accurate data and is the only way to reliably compare data between samples. For example, in Figure 1 below, the blot on the left doesn’t show a trend because the sample loading was inconsistent. However, when sample loading is consistent, a clear trend appears.

While performing an assay before you can begin your Western blot may seem inconvenient, protein estimation assays offer several benefits that make them well worth the added effort. Protein estimation assays can:
- Result in fewer blot repetitions
- Save you time, sample, and resources
- Provide more accurate and significant data
- Identify sample loading within the linear range for normalization
- Reveal extraction protocol issues
- Align with publisher guidelines
What Are Protein Estimation Assays?
Protein estimation assays estimate the amount of protein in a lysate. A sample with protein or lysate is added to a reagent and compared to a blank sample with only buffer. The amount of light absorbed by the sample provides an estimate of protein concentration. Data from replicates is then plotted to find the standard curve.
Types of Protein Estimation Assays Using Absorbance
There are many versions of protein estimation assays, but the three most common are shown below. Each assay type has advantages and disadvantages. Each also has unique characteristics that must be considered. For example, the BCA assay can be used with detergents, but the Bradford and Lowry assays cannot.
Bradford Assay
| Advantage | Disadvantages |
|
|
|---|
Lowry Assay
| Advantage | Disadvantages |
|
|
|---|
BCA Assay
| Advantage | Disadvantages |
|
|
|---|
Estimating Protein with an Odyssey® M Imaging System
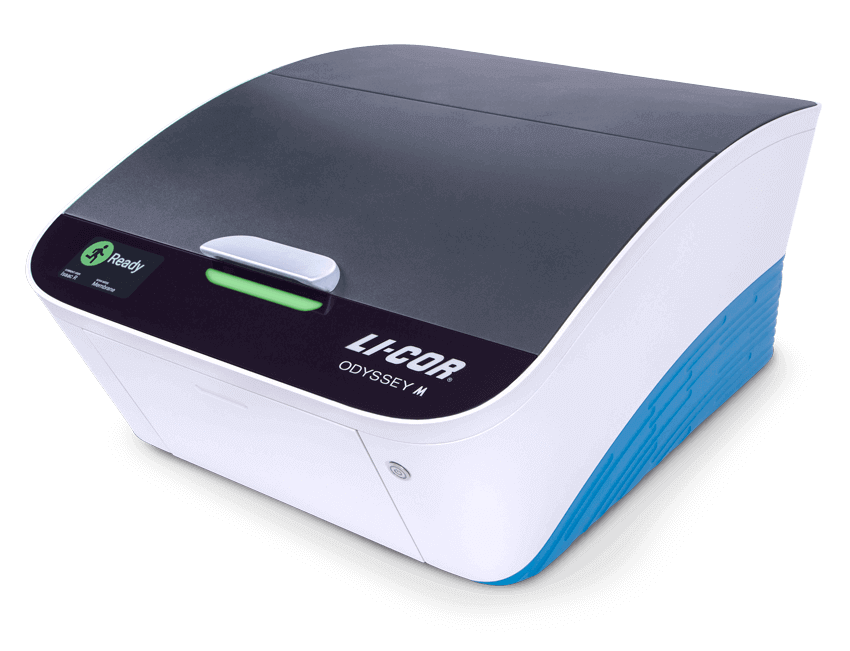
Now you can perform your protein estimation assays and Western blots using the same imager. The Odyssey M Imager provides three transillumination channels (470 Trans, 526 Trans, and 630 Trans) for you to image your absorbance-based assays.
Protein estimation images acquired on an Odyssey M can be imported into Empiria Studio® Software to quantify absorbance values. Then, use those values to obtain your standard curve.

Resources
- Protein Concentration Estimation Application Guide
- Applications for Advancing Research Brochure
- Solutions for Advanced Scientific Research Brochure
- Protein Concentration
