Developing a 3-Color Western Blot
Introduction
The popularity and longevity of Western blotting are due to how much information can be obtained from a properly controlled and executed experiment. Western blotting uses specific antibodies to detect a target protein in a complex protein mixture that has been immobilized on a membrane.
Western blotting can provide information about target protein size, relative target abundance, target location (if the sample was fractionated), and if the target is affected by a treatment (e.g., drug, small molecules, temperature shift).
Over time, the desire to detect multiple proteins within a sample has emerged, leading scientists to develop several methods for simultaneous protein detection on a single membrane—including multiplexed Western blots. Multiplexed Western blots can be performed using any Odyssey Imager, but the Odyssey M Imager is the only one capable of performing 3-color Western blots.
Western blot data is only as good as the antibodies used and the attention given to the parameters of the experiment. This is especially true when trying to perform a spectrally distinct 3-color Western blot. The parameters include but may not be limited to:
Membrane type
Gel type
Transfer conditions
Blocking buffer selection
Primary/secondary antibody compatibility (especially with host derivation and target species)
Combined antibody linear range
Here are some things to keep in mind to achieve meaningful results when detecting three unique targets. Where possible, use the knowledge you have as a base and build from there.
See the Fluorescent Western Blot Detection protocol for a detailed, step-by-step protocol to multiplex fluorescent Western blots.
Determine Your Targets and Sample Type
First, determine what target proteins you would like to detect, then determine if all of your targets are expressed in a single sample. If all your targets are not expressed in your sample, you may be able to find an alternative sample type, such as a transfected lysate or knock-in cell line, that may work depending on your experimental needs.
There are several different ways to determine if all of your targets are expressed in a single sample.
Start with your lab
The information may already be available from earlier data produced by your lab. Check with your lab team to identify antibodies and samples that have been well characterized.
Search citations
Literature citations are another means to find specific details, including experiment pictures, media, samples, and drug timing and conditions of use.
Check manufacturer and vendor websites
Antibody manufacturer and vendor websites often show Western blot examples to demonstrate product characteristics and species reactivity in a variety of lysates and tissues.
Explore GeneCards®
GeneCards®: The Human Genome Database catalogs the expression of genes in human tissue and orthologs of that gene in animals–including animals that do not express that gene.
Know Your Molecular Weights
Be sure you know the expected molecular weights of your target proteins. The molecular weight is important when determining the correct gel percentage and type for SDS-PAGE. These factors will help you choose the right transfer conditions and attain the best resolution of bands.
Large proteins generally require a lower percentage acrylamide and transfer better with low methanol and extended transfer times. Small proteins require a high percentage acrylamide, high methanol concentrations, and shorter transfer times to bind them to the membrane and keep them from passing through the membrane.
Determine the Right Membrane
If your lab is already using one or two antibodies, identify what membrane was used for your antigen-antibody pairs. The chemistry of PVDF and nitrocellulose membranes differ, which makes them unique in their protein binding, chemical resistance, and background noise. If your antibody-antigen pairs have not been tested on both, it is worth the time to determine which membrane gives you the best signal-to-noise ratio.
Choose the Right Blocking Buffer
Blocking buffer is crucial when using multiple antibodies. No single blocking buffer will be optimal for every antigen-antibody pair. Some primary antibodies are dramatically affected by blocking conditions. Look for a blocking buffer that provides:
Strong signals for the expected band(s)
Low membrane background
Ideally, no non-specific background bands from the primary antibody
Try at least three different types of blocking buffer to determine which gives you the best signal with the lowest background for each target by themselves. Whichever works for all three targets will be the one you choose.
You may find that one blocking buffer over-blocks, while another does not block well enough. You can combine blocking buffers to get an “in-between” result. For example, if you tried Intercept® (TBS) Blocking Buffer and Intercept (TBS) Protein-Free Blocking Buffer and found that one over-blocks, while the other shows too many bands, you can mix the two blockers at different ratios (e.g., 75:25 or 50:50) and try blocking again to see if you get a result that works in your experiment.
See the Western Blot Blocker Optimization for Near-Infrared (NIR) Detection protocol for more information.
Select Your Antibodies Carefully
Your choice of antibodies is critical for a 3-color Western blot. Antibody selection can be challenging. Visible fluorescent secondary antibodies should be used for your target with the highest abundance to minimize the background inherent at these wavelengths. Near-infrared fluorescent secondary antibodies should be used for proteins with lower abundance. We recommend choosing antibodies that have worked for either you or your lab, then continue to develop your experiment from that point.
Remember, all targets must be detected within the same linear range.
Verify Primary Antibodies
If you have existing information for one or two target antibodies, verify:
That the antibody has been used for detection of your target in your chosen sample type.
If it has, confirm the correct primary antibody concentration in your own experiment to establish the linear range. Use the same blocking buffer as was used before
If not, try the vendor’s suggested dilution. If you are given a dilution range, first try the middle of that range. Detect your target in a dilution series of your sample type using a minimum of three different blocking buffers. Choose the most suitable blocking buffer, then determine the antibody concentration that provides the best signal-to-noise ratio.
The linear range using the optimum antibody concentration and blocking buffer using a dilution series of your sample.
Keep Host Species in Mind
When selecting your primary and secondary antibodies, pay careful attention to the host species of the primary antibody (e.g., rabbit host anti-ERK) and the host species and source of the secondary (e.g., goat host anti-rabbit source). Your primary antibodies must be derived from different host species, so they can be distinguished by secondary antibodies of different specificities. Your secondary antibody source must match your primary antibody host species.
Antibodies generated in species that are closely related—such as mouse and rat or goat and sheep—should not be multiplexed together. This is because the secondary antibodies will cross-react with both species.
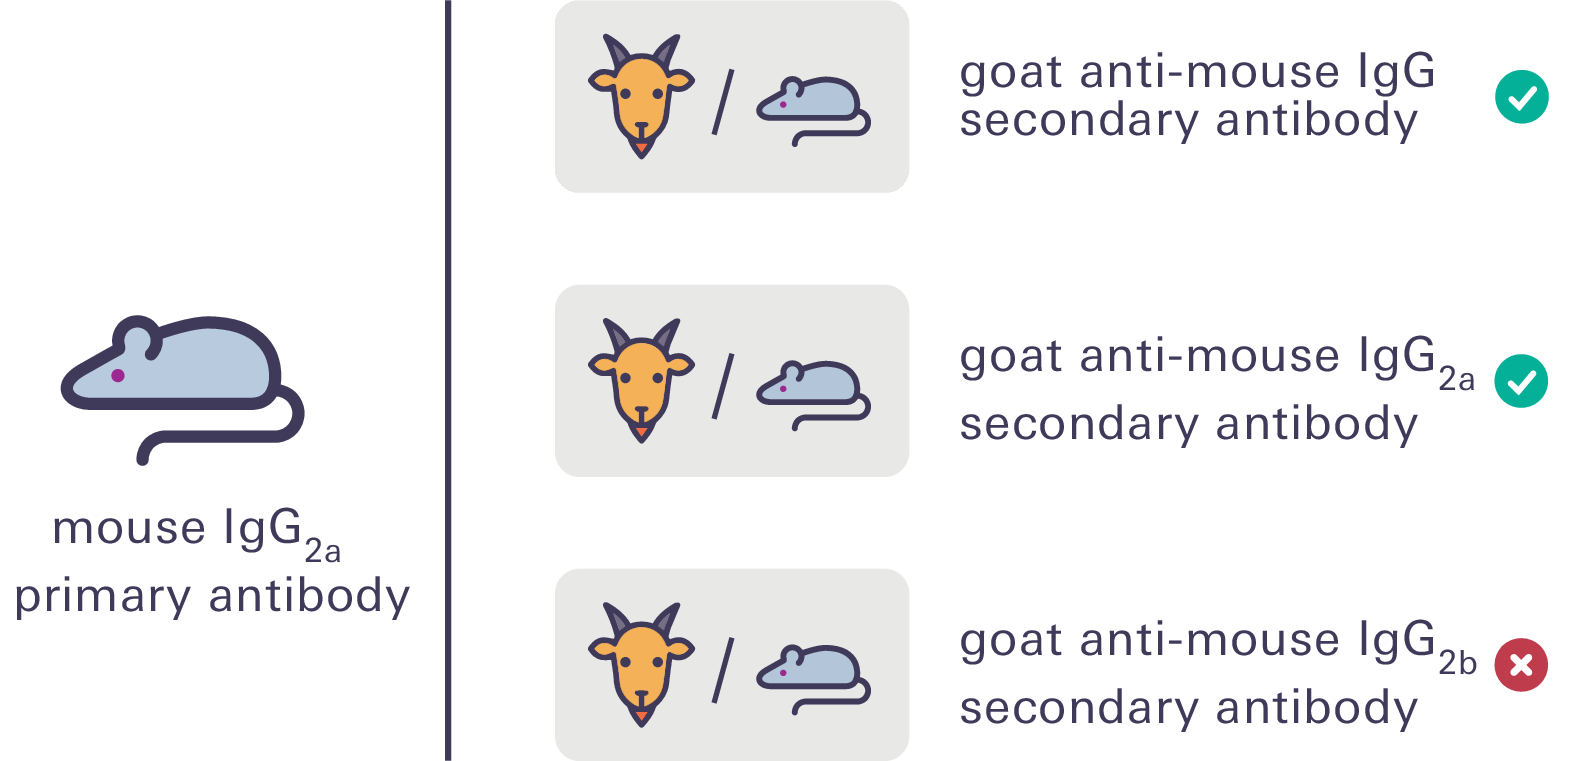
To help with pairing antibodies, take advantage of the specificity of different mouse monoclonal IgG subclasses (e.g., IgG1, IgG2a, IgG2b). Then, you can use IRDye® subclass-specific secondary antibodies for multiplex detection. Be sure to confirm the specificity of the subclass when using this type of pairing.
See the Western Blot and In-Cell Western™ Assay Detection Using IRDye® Subclass Specific Antibodies technical note for more information.
Example Screening of Multiple Antibodies
Eight antibodies were screened at once using the MPX™ Multiplexer Blotting System. The antibodies were screened with two separate blocking buffers and five secondary antibodies. The antibodies used for screening include a whole antibody goat anti-mouse (GaM) secondary as a positive control, three different mouse subclass antibodies, a rabbit primary, and a goat primary. The use of two blocking buffers provided the bonus of establishing a blocking buffer for the antibodies.
If the antibodies were not already optimized in the lab, they were diluted using vendor recommendations. The same was true for the secondary antibodies. The nitrocellulose membrane had already been optimized in past experiments.
You can perform this experiment using replicate samples in gels of 15 to 26 wells transferred to a membrane and cut into separate pieces for detection using blot boxes. See One-Blot Western Optimization Using the MPX Multiplexer Blotting System for details on how to use the MPX Multiplexer Blotting System with an Odyssey Imager.
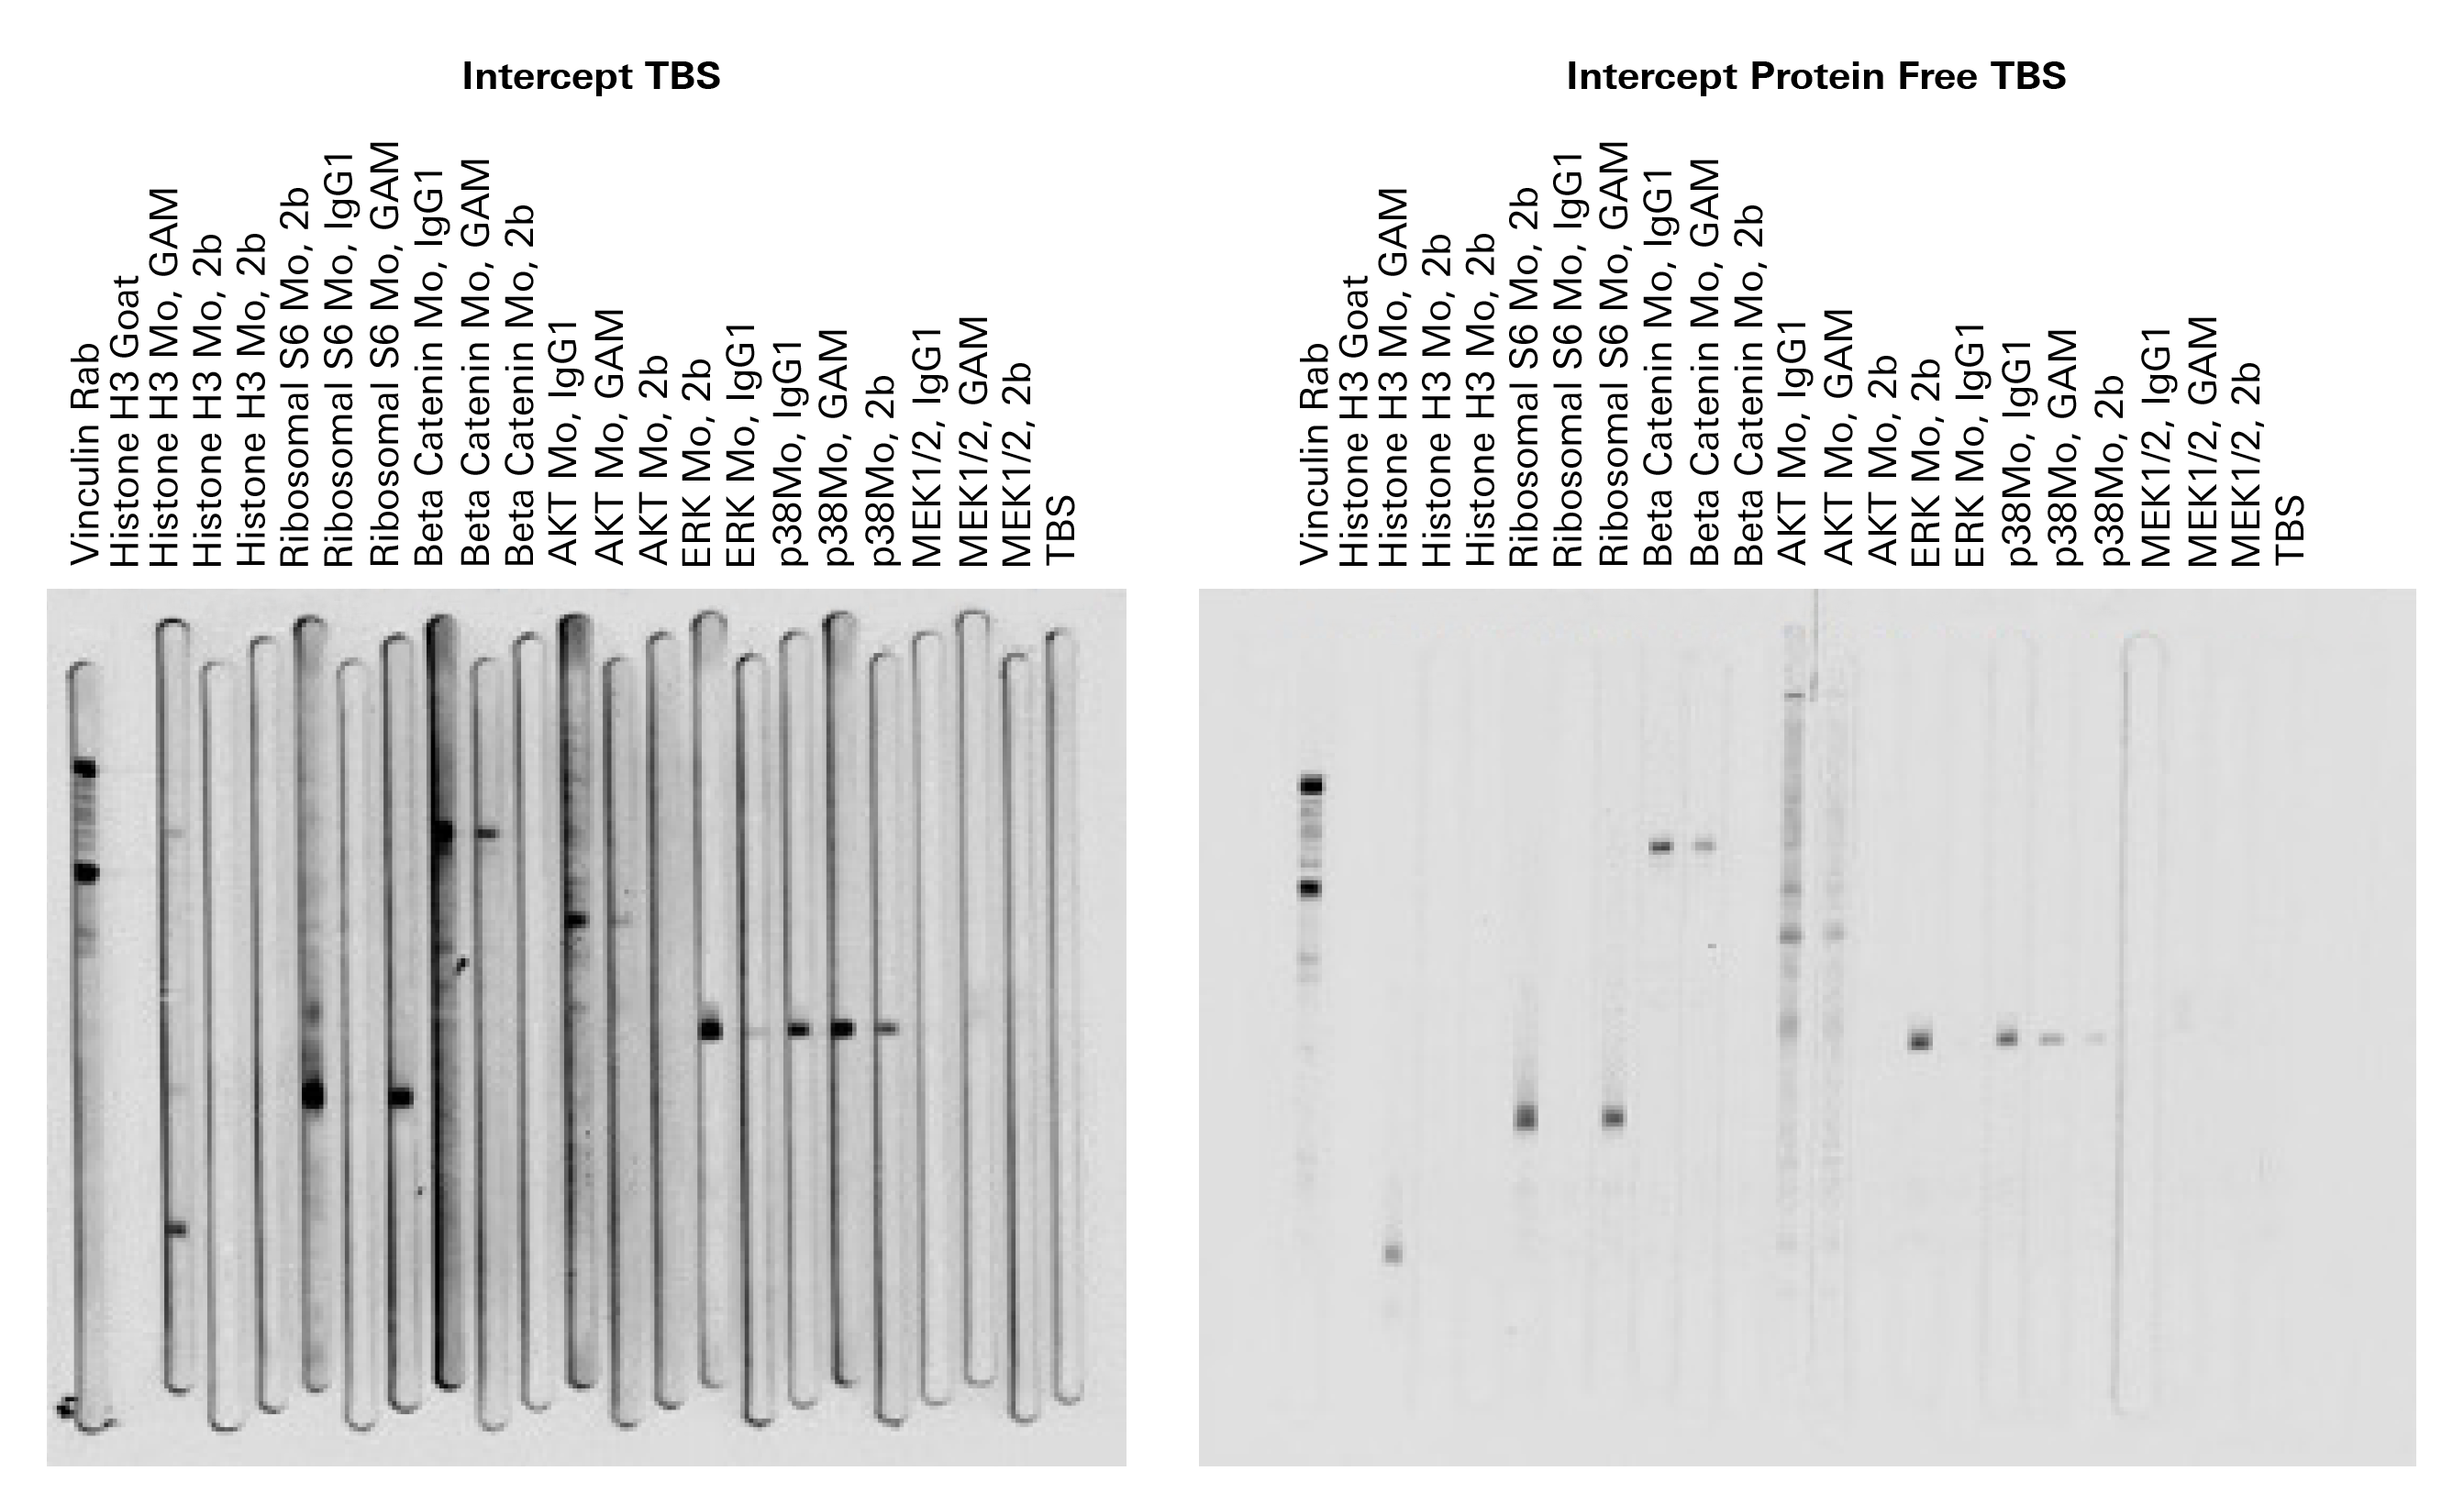
The results in Table 5 indicated the expected reactivity, with the exception of anti-p38 and anti-MEK 1/2. Anti-p38 showed cross-reactivity with IgG2b secondary antibody. Anti-MEK 1/2 was not recognized by any secondary antibody in either blocking buffer.
Examples of Successful Antibody Combination
The following 3-color Western blots combined the information obtained from the MPX™ System experiment with prior knowledge about a rabbit anti-hu cofilin antibody used extensively in the lab.
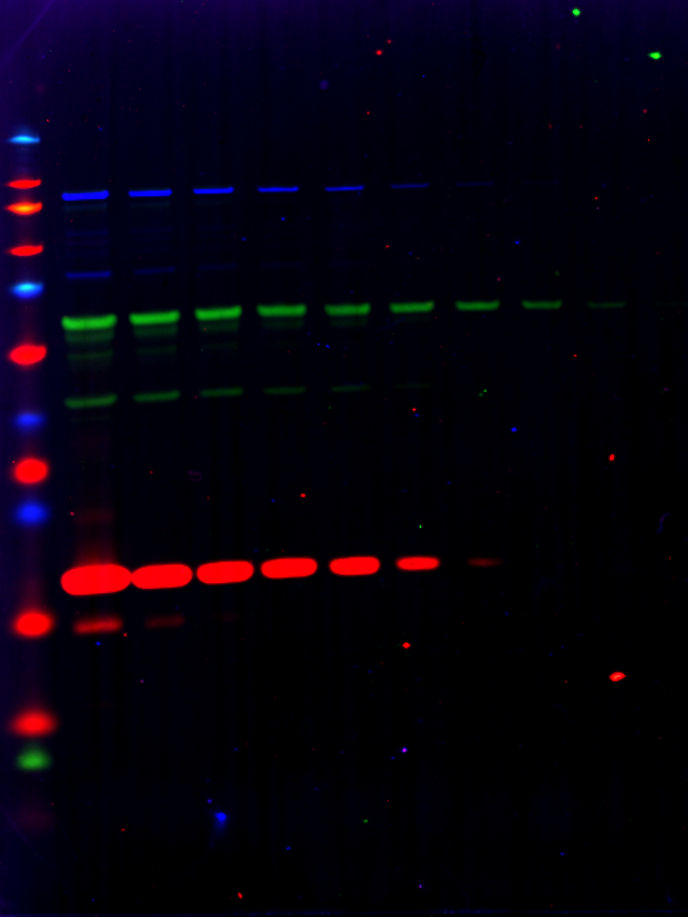
Example 1
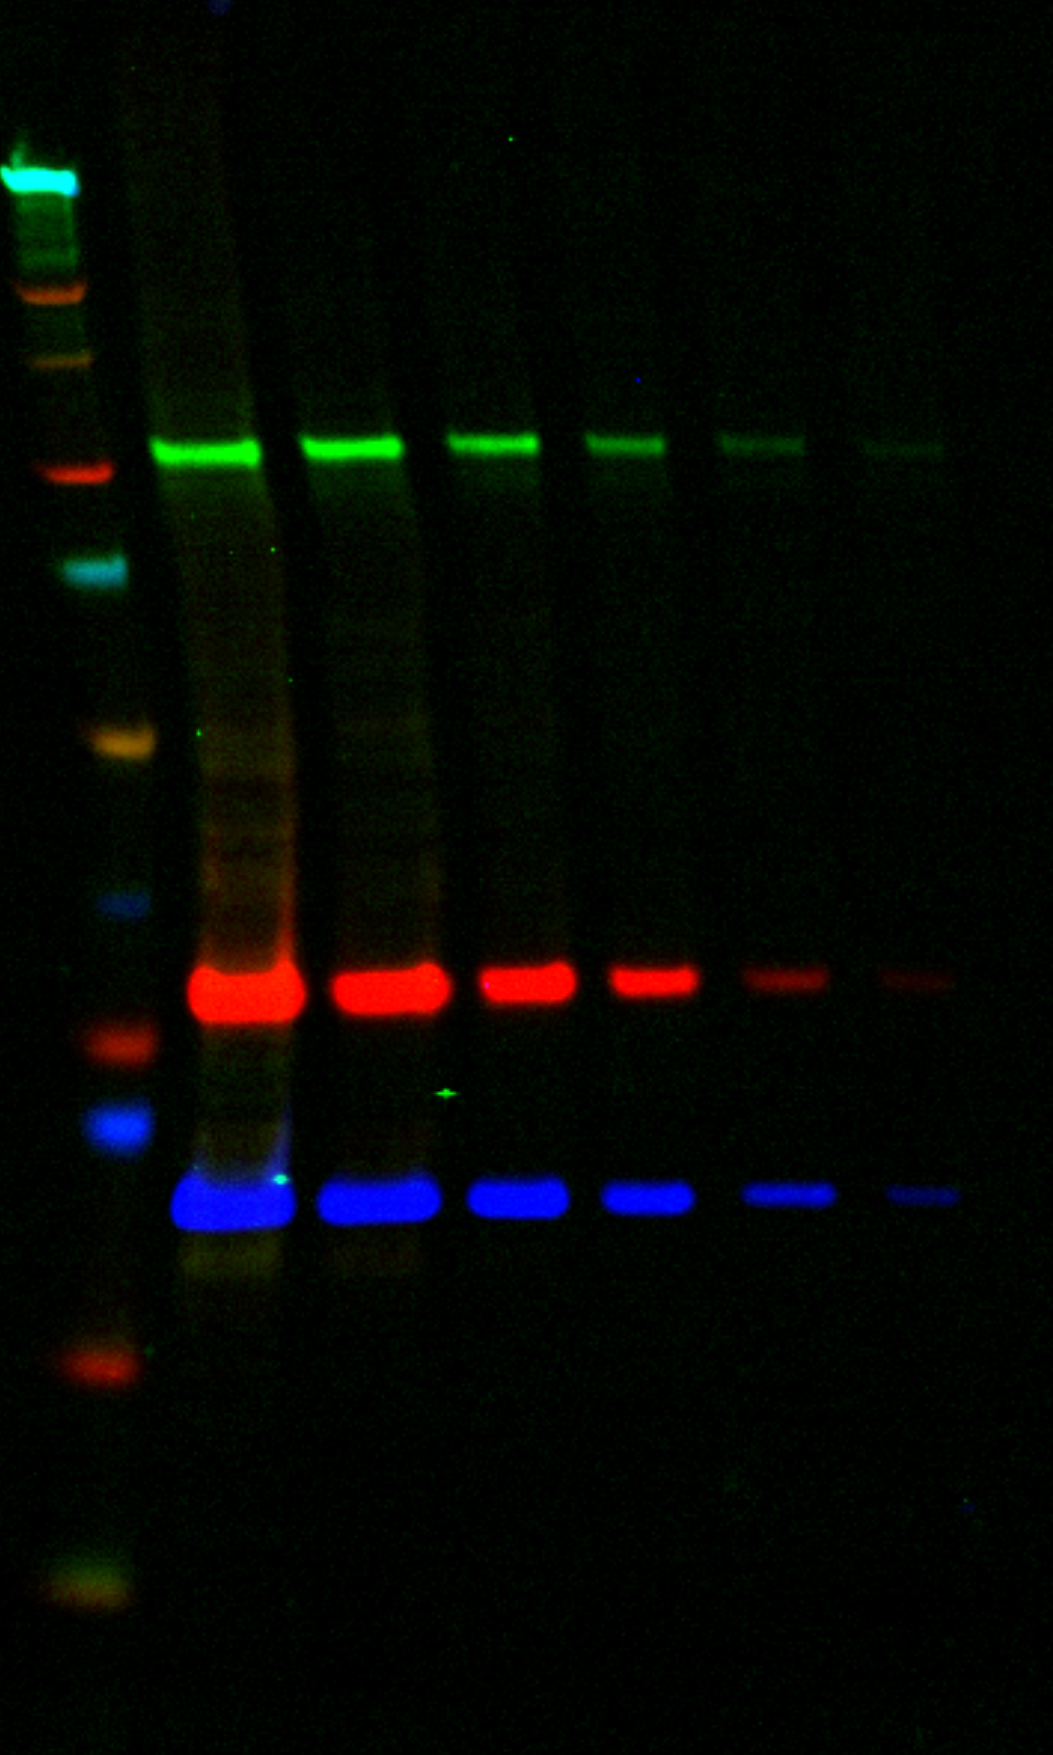
A Western blot using a two-fold serial dilution of NIH3T3 lysate starting at 20 µg per lane. The subclass specificity of the mouse monoclonals was exploited so that two mouse primary antibodies and one rabbit primary antibody could be combined and detected using two goat anti-mouse subclass specific secondary antibodies and a goat anti-rabbit secondary antibody. |
| Target | Primary Antibody | Secondary Antibody | Color |
| Beta Catenin | Mouse IgG1 | IRDye® 800CW Goat anti-Mouse IgG1 | Green |
| Ribosomal S6 | Mouse IgG2b | IRDye 680LT Goat anti-Mouse IgG2b | Red |
| Cofilin | Rabbit | VRDye™ 549 Goat anti-Rabbit | Blue |
Example 2
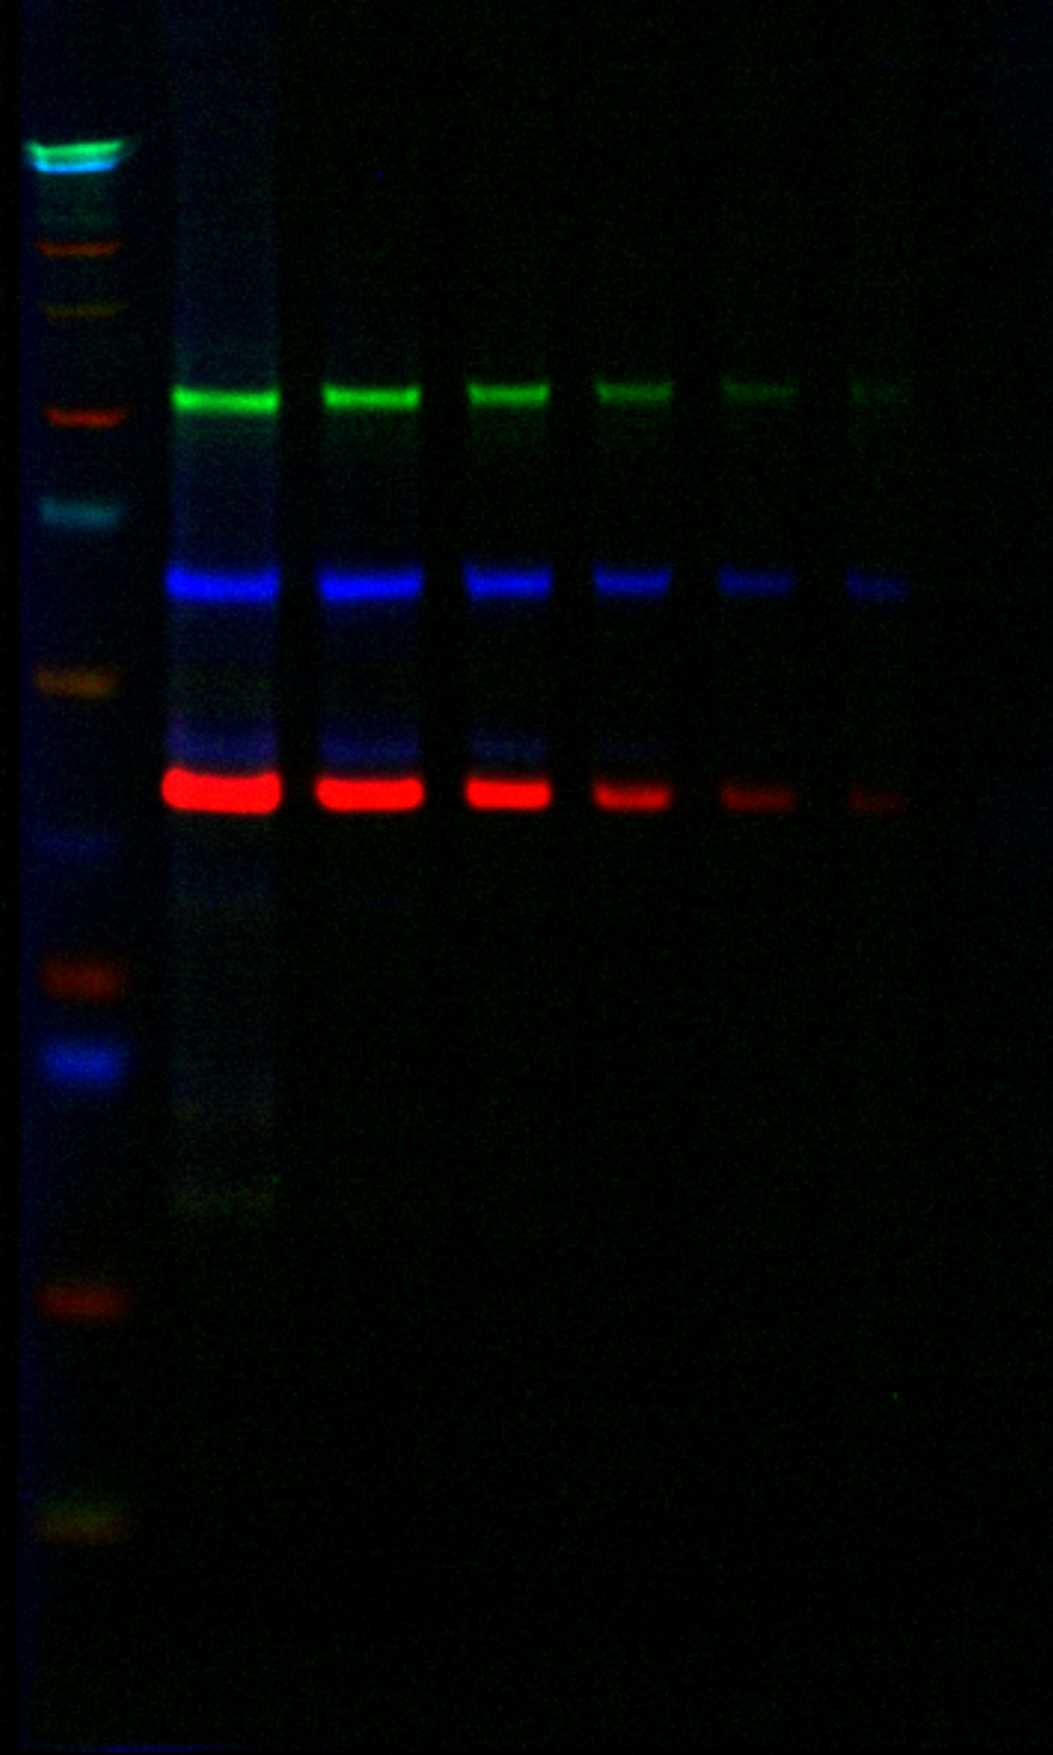
Two different mouse primary antibodies and one rabbit primary antibody were combined in the same lysate as Example 1 and detected using two goat anti-mouse subclass specific secondary antibodies and a goat anti-rabbit secondary antibody. |
| Target | Primary Antibody | Secondary Antibody | Color |
| Beta Catenin | Mouse IgG1 | IRDye® 800CW Goat anti-Mouse IgG1 | Green |
| AKT | Rabbit | VRDye™ 549 Goat anti-Rabbit | Blue |
| ERK | Mouse IgG2b | IRDye 680LT Goat anti-Mouse IgG2b | Red |
Example 3
A Western blot using a two-fold serial dilution of NIH3T3 lysate starting at 20 µg per lane. In this example, a LI-COR housekeeping protein was used as one of the target antibodies, along with two antibodies screened in the MPX™ System experiment. In this case, rabbit, chicken, and mouse primary antibodies were combined and detected using donkey or goat secondary antibodies with rabbit, chicken, or mouse antigen sources. |
| Target | Primary Antibody | Secondary Antibody | Color |
| Vinculin | Rabbit | VRDye™ 549 Goat anti-Rabbit | Blue |
| Vimentin | Chicken | IRDye® 800CW Donkey anti-Chicken | Green |
| Histone H3 | Mouse | IRDye 680RD Goat anti-Mouse | Red |
Examples of Problematic Antibody Combinations
The following 3-color Western blots may have issues with the performance of antibodies as shown.
Example 1
Rat and mouse antibody combinations are not recommended unless experiments have been performed to confirm that the secondary antibodies, goat anti-mouse and goat anti-rat, do not cross-react. This is regardless of the secondary host, goat, or donkey combinations. |
| Target | Primary Antibody | Secondary Antibody |
| X | Mouse | IRDye® 680RD Goat anti-Mouse |
| Y | Rabbit | VRDye™ 549 Goat anti-Rabbit |
| Z | Rat | IRDye 680RD Goat anti-Rat |
Example 2
In this case, either the goat primary or a different host other than goat conjugated secondary antibody would need to be selected in order for this 3-color Western blot to work. |
| Target | Primary Antibody | Secondary Antibody |
| X | Mouse | IRDye 680RD Donkey anti-Mouse |
| Y | Goat | VRDye 549 Donkey anti-Goat |
| Z | Human | IRDye 680RD Goat anti-Human |
Example 3
It's possible that this combination may work. However, the goat anti-human secondary antibody would have to be tested alone and with the X and Y antibodies to evaluate if there is any significant binding to either antigen. |
| Target | Primary Antibody | Secondary Antibody |
| X | Mouse | VRDye 549 Goat anti-Mouse |
| Y | Guinea Pig | IRDye 800CW Donkey anti-Guinea Pig |
| Z | Human | IRDye 680RD Goat anti-Human |
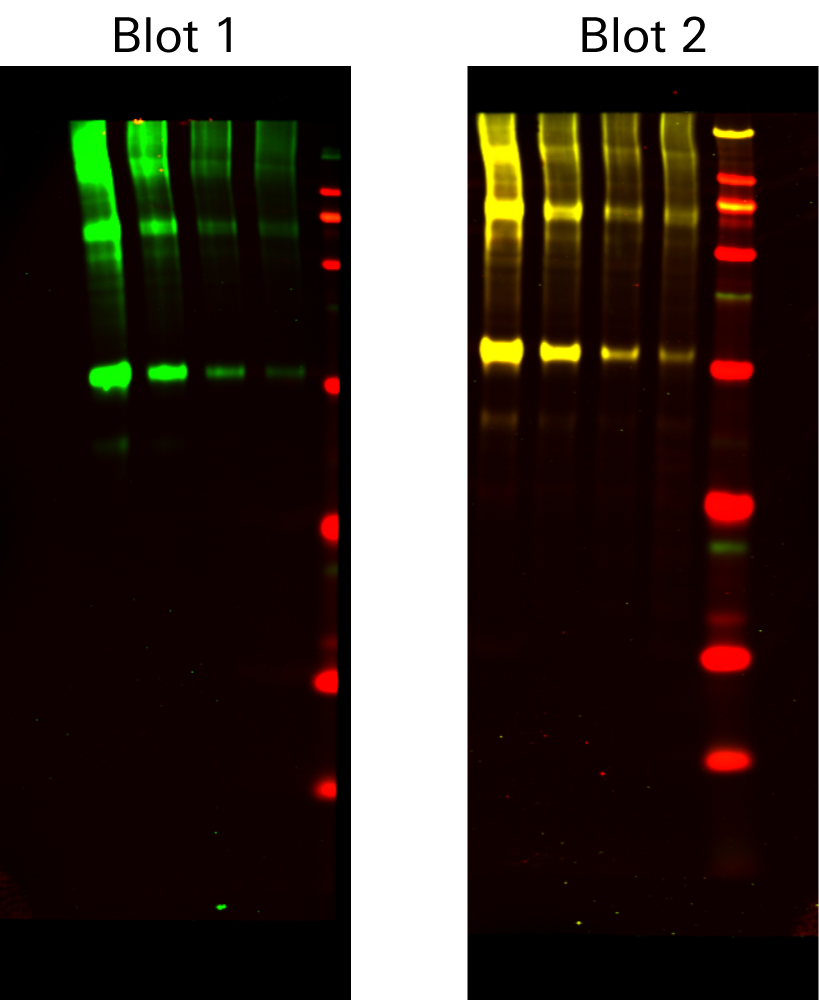
Example 4
This is an example of two 2-color Western blots to illustrate cross-reactivity. In Blot 1, c-Myc was detected using IRDye® 800CW Goat anti-Mouse Secondary Antibody alone as expected. In Blot 2, c-Myc was again detected using IRDye 800CW Goat anti-Mouse Secondary Antibody. When another secondary antibody, IRDye 680RD Donkey anti-Goat, was introduced to the blot, it recognized the goat anti-mouse secondary antibody. Yellow signal indicates where the two secondary antibodies cross-react. |
| Target | Primary Antibody | Secondary Antibody |
| c-Myc | Mouse | IRDye 800CW Goat anti-Mouse |
| None | None | IRDye 680RD Donkey anti-Goat |
Find the Combined Linear Range
You will want to find the combined linear range for all antigen-antibody combinations. Why is this important? The linear range is the range of sample loading that produces a linear relationship between the amount of target on the membrane and the signal intensity recorded by the detector. If signal is linear, doubling the protein concentration should lead to an approximate doubling of the signal intensity. Outside this range, signal intensity is not dependent on sample loading and does not accurately reflect the amount of target present–which means quantification is not accurate.
See Figure 1 in the Determining the Linear Range for Quantitative Western Blot Detection protocol for more information.
Graphing the signal vs. sample loading of your target and then establishing the linear range allows quantification to be accurate. Quantitative Western blot analysis is accurate only if the target proteins and internal loading control can be detected within the same linear range. As a result, you must work within the combined linear range of all the antibodies in your multiplexed experiment.
See Lambda U® On-Demand Western Blot Education Portal for courses on determining the linear range for quantitative Western blots.
Examples of Combined Linear Range with Multiple Targets
Due to the number of antibodies used, 3-color Western blots will generally have a narrow combined linear range.
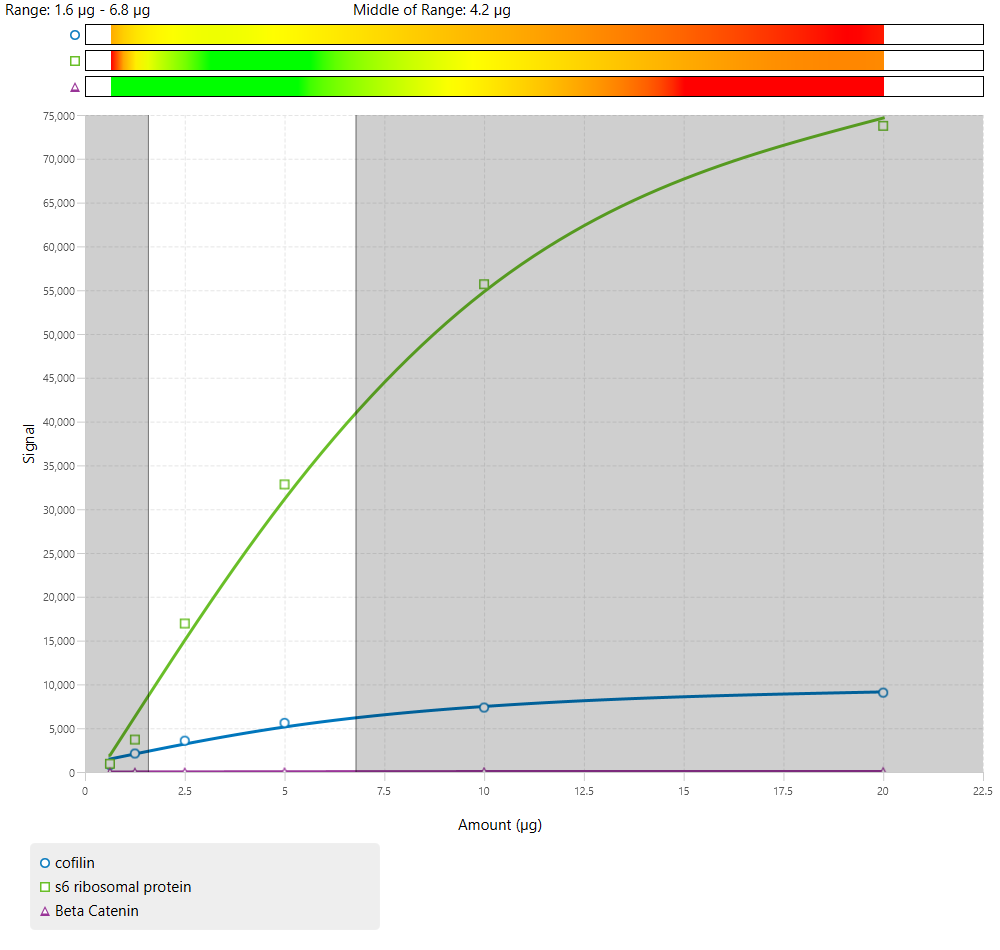
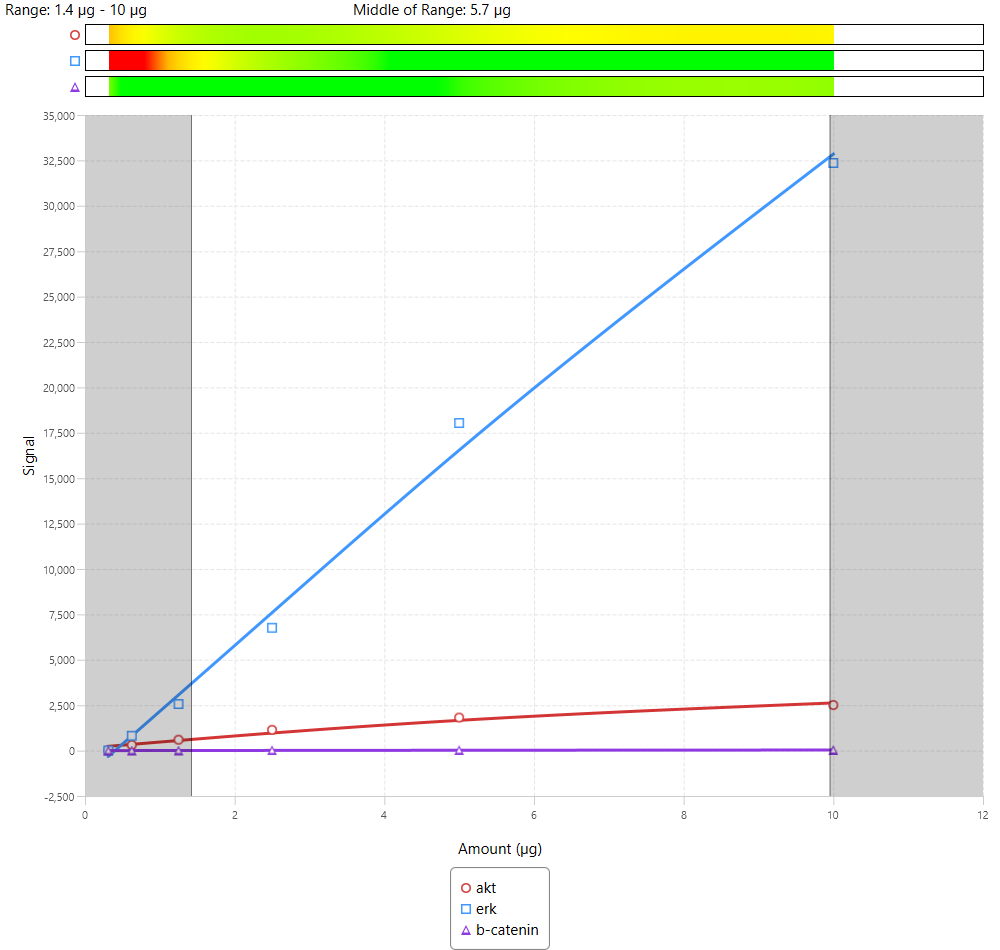
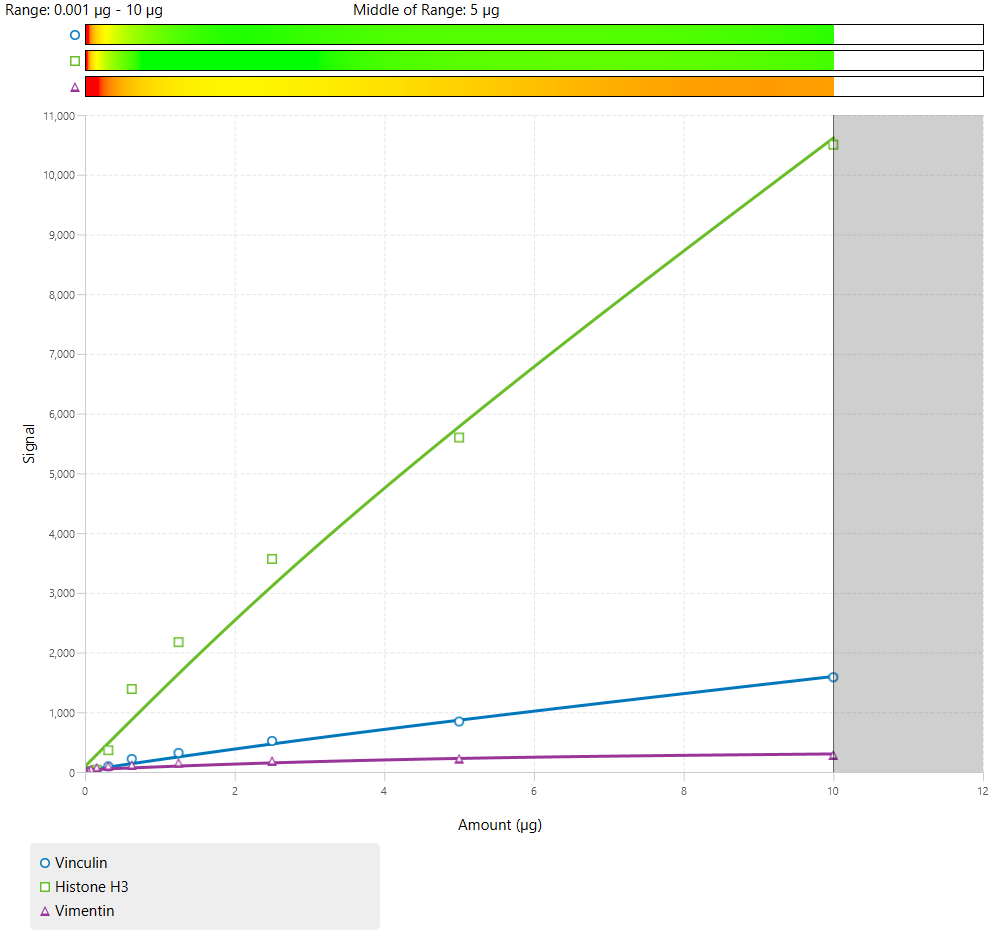
Of these examples, all could be used. However, Figure 64 has the widest combined linear range, which provides more flexibility in the amount of sample loading for an experiment.
Conclusion
The wide variety of visual secondary antibodies offers seemingly endless possibilities for target protein detection. However, visual dyes can be tricky to work with and may require much more planning for multiplexed experiments. For Western blots, the higher background of visible wavelengths will be an ongoing issue, as will pairing three antibodies in a single experiment that can all be detected within a combined linear range.
Pairing two antibodies with a total protein stain, such as Revert™ 520 Total Protein Stain, is a robust alternative for those who plan to normalize. Either option (three antibodies or two antibodies with a total protein stain) is substantially better than stripping and reprobing membranes. With proper research, careful planning, and a moderate amount of optimization, you can produce solid, successful, and quantitative 3-color Western blots.
Resources
For more information about quantitative Western blot analysis, see the following resources.
Technical Documents
Lambda U® On-Demand Western Blot Education Portal Courses
Other Resources
Towbin, H., Staehelin, T., and Gordon, J. (1979). Electrophoretic transfer of proteins from polyacrylamide gels to nitrocellulose sheets: Procedure and some applications. Proceedings of the National Academy of Sciences, 76(9), 4350. https://doi.org/10.1073/pnas.76.9.4350
Pillai-Kastoori, L., Heaton, S., Shiflett, S. D., Roberts, A. C., Solache, A., and Schutz-Geschwender, A. R. (2019). Antibody validation for Western blot: By the user, for the user. Journal of Biological Chemistry, 295(4), 926–939. https://doi.org/10.1074/jbc.RA119.010472